
Plan vs. Actual in HubSpot: Sales Steering With UI Extensions, n8n, and BI Data
How we brought plan figures, seasonality, and BI data together in a HubSpot UI Extension. With n8n, React, and real revenue data from Qlik.

Plan vs. Actual in HubSpot: Sales Steering With UI Extensions, n8n, and BI Data
Plan figures in Excel. Revenue in the BI tool. CRM data in HubSpot. And the sales manager with three tabs open, trying to figure out whether a customer is on track.
That was the reality at one of our clients -- a mid-sized company in the timber trade with a field sales team and a dealer network as their customer base. The sales reps had delivered clean plan figures per dealer for 2026. Actual revenue was available in Qlik. But nobody had brought it all together. Especially not where sales actually works: in the CRM.
The question was simple: Can you make plan vs. actual visible directly in HubSpot? Per customer, per month, with seasonality?
The answer: Yes. With a HubSpot UI Extension, an n8n workflow, and a bit of math.
The Starting Point
The company does not sell directly to end customers. They work with dealers. Each dealer has a dedicated field sales rep who provides plan figures for the coming year: "Dealer X should generate 120,000 EUR in revenue in 2026."
These plan figures lived in Excel spreadsheets. Actual revenue was analyzed in Qlik (BI tool). Any comparison happened quarterly at best, and manually.
The problems:
- No real-time view of whether a dealer is on track
- Seasonality is ignored. A dealer with 60,000 EUR revenue in June might still be on plan, even if the annual target is 120,000 EUR
- Sales reps have to jump between three tools
- Plan vs. actual deviations are spotted too late
The Idea: Show Everything Where Sales Actually Works
Instead of building another dashboard in another tool, the approach was: bring plan figures and actual revenue together directly in HubSpot. On the company page of each dealer, as a custom card that the sales rep sees immediately.
For that, we needed four building blocks:
- Plan figures in HubSpot, as custom properties on the company
- Seasonality distribution, so the monthly targets are realistic
- Actual revenue automatically from Qlik, via an n8n workflow
- A UI Extension that brings it all together visually
Step 1: Import Plan Figures
The sales reps delivered their annual plan figures per dealer as an Excel file. These were imported as a custom property planzahl_2026 on the corresponding company object in HubSpot.
Sounds simple. It is. The plan figure is set once per year and serves as the reference value for everything else. No ongoing sync needed, a one-time import is enough.
Step 2: Calculate Seasonality
Dividing the annual target by 12 would be wrong. In the timber trade, there are massive seasonal swings. January generates significantly more revenue than December.
From the historical revenue data in Qlik, I calculated the average monthly distribution of annual revenue. This produces a seasonality factor per month:
| Month | Share of Annual Revenue | Factor |
|---|---|---|
| January | 13.0% | 0.130 |
| February | 8.4% | 0.084 |
| March | 9.0% | 0.090 |
| April | 10.0% | 0.100 |
| May | 11.2% | 0.112 |
| June | 11.8% | 0.118 |
| July | 11.0% | 0.110 |
| August | 7.2% | 0.072 |
| September | 6.8% | 0.068 |
| October | 5.1% | 0.051 |
| November | 4.3% | 0.043 |
| December | 2.2% | 0.022 |
Note: The factors in this article are simplified.
The calculation for the target revenue per month:
TARGET_month = Plan_year x Seasonality_factor_month
Example: A dealer with a 1,000,000 EUR annual target has a January target of 130,000 EUR, but only 22,000 EUR in December. Without seasonality, you would set a linear 83,333 EUR per month and be thrilled in January and panicking in December. Both for no reason.
Step 3: Sync Actual Revenue From Qlik to HubSpot Automatically
The actual monthly revenue per dealer is available in Qlik. To keep HubSpot up to date, an n8n workflow runs that synchronizes the data automatically.
How the workflow works:
- Qlik API -- fetch revenue data
- n8n -- map data to companies
- HubSpot -- update custom properties (
umsatz_jan,umsatz_feb, ...)
The workflow runs on a regular schedule and updates the monthly actual revenue as custom properties on the company in HubSpot. So each company has two data sets:
- TARGET:
planzahl_2026+ seasonality factors -- calculated monthly target - ACTUAL:
umsatz_jan_2026,umsatz_feb_2026, ... -- real monthly values
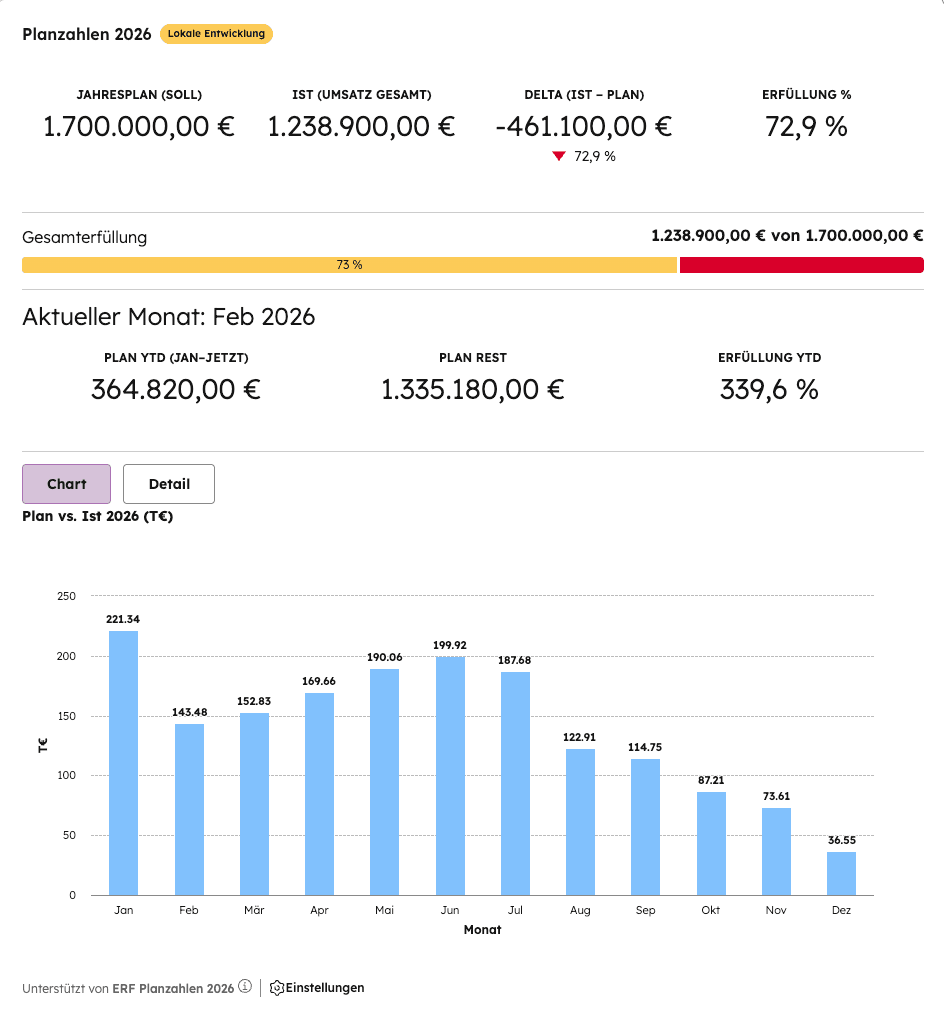
Step 4: The UI Extension
The visible part: a HubSpot UI Extension, built with React in the official HubSpot Developer Framework. The extension appears as a custom card directly on the company page in HubSpot.
What the extension shows:
- Annual overview: TARGET (plan figure), ACTUAL (cumulative revenue), delta, and fulfillment percentage
- Progress bar: Visual overall fulfillment
- Monthly view: Current month with plan YTD, plan remaining, and fulfillment YTD
- Chart: Plan vs. actual per month as a bar chart with seasonally adjusted target values
Simplified code example, seasonality calculation in the extension:
// Seasonality factors (simplified)
const SEASONAL_FACTORS = [
  0.130, 0.084, 0.090, 0.100, 0.112, 0.118,
  0.110, 0.072, 0.068, 0.051, 0.043, 0.022
];

// Calculate monthly target
const getMonthlyTarget = (yearlyPlan, monthIndex) => {
  return yearlyPlan * SEASONAL_FACTORS[monthIndex];
};

// Calculate YTD target (cumulative up to current month)
const getYtdTarget = (yearlyPlan, currentMonth) => {
  return SEASONAL_FACTORS
    .slice(0, currentMonth + 1)
    .reduce((sum, factor) => sum + yearlyPlan * factor, 0);
};

// Example: 1,000,000 EUR annual target
getMonthlyTarget(1000000, 0);  // January: 130,000 EUR
getYtdTarget(1000000, 1);      // Through Feb: 214,000 EUR
Simplified code example, loading CRM data in the extension:
// Load properties from the company
const properties = [
  'planzahl_2026',
  'umsatz_jan_2026', 'umsatz_feb_2026', // ...
];

// In the extension
const yearlyPlan = company.properties.planzahl_2026;
const actualRevenue = getYtdRevenue(company.properties);
const fulfillment = (actualRevenue / getYtdTarget(yearlyPlan, currentMonth)) * 100;
The code examples are simplified and show the basic principle. The production extension also includes error handling, loading animations, and formatting logic.
The Result
The sales manager opens a company in HubSpot and sees immediately:
- Is the dealer on track? Fulfillment as a percentage and progress bar
- How is it distributed across the year? Monthly bar chart with seasonally adjusted targets
- Where do we stand YTD? Cumulative comparison, not just the current month
No switching to Qlik. No opening Excel. No waiting for the quarterly meeting.
An example from the project:
- Annual plan: 1,000,000 EUR
- Actual revenue: 1,173,700 EUR
- Fulfillment: 117.4% -- the dealer is ahead of plan
- The sales rep sees this as soon as they open the contact
The Tech Stack
| Component | Role |
|---|---|
| HubSpot CRM | Central data store (plan figures + actual revenue as custom properties) |
| HubSpot UI Extension (React) | Visual display as custom card on the company page |
| n8n | Automated sync of actual revenue from Qlik to HubSpot |
| Qlik | BI tool as data source for actual revenue |
Why This Works
Many B2B companies with indirect sales know this problem: plan figures and reality live in different systems. Deviations are spotted too late, sales reps lose track, and the CRM stays a contact directory instead of a steering tool.
With a UI Extension, n8n as the data pipeline, and seasonally adjusted plan calculations, the plan vs. actual comparison becomes visible right where sales works: in the CRM.
The solution already works with HubSpot Free CRM. For the UI Extension, you only need a HubSpot Developer Account.
Want to Build Something Similar?
If your sales team is jumping between three tools today to answer a simple question, let us talk.
Written by Joshua Kresse -- Founder of Pipewave. I build automations and integrations for B2B companies that use HubSpot as their CRM.